Talk to Sales
RCM Analytics Software ROI: Executive Dashboards and Data-Driven Revenue Cycle Decisions

Claims go out. Money should come back. When it doesn't, you need to know why and you need to know now.
Your billing team is not the problem. The problem is that the data explaining denial spikes, payment slowdowns, and collection shortfalls lives in disconnected spreadsheets and arrives in monthly reports long after the damage is done. RCM analytics software consolidates that data and surfaces it while you can still act on it.
Key Takeaways
Most healthcare organizations recover their analytics investment within 12 to 18 months through lower denial rates and faster payment cycles, according to benchmarks from the Healthcare Financial Management Association (HFMA). Executive dashboards deliver real-time visibility by payer, provider, and department — so you see problems as they emerge, not after month-end close. Predictive analytics catches claim errors before submission, which means cleaner claims, fewer rejections, and steadier cash flow.
What Is RCM Analytics Software ROI and Why Does It Matter?
RCM analytics software ROI is simple: the revenue you recover and the costs you eliminate, measured against what the software costs. Calculating that return starts with identifying where money leaks out of your revenue cycle today.
Analytics examines every stage — eligibility verification, claim submission, denial management, and payment posting. Visibility into each step reveals what is broken. Cleaner claims go out. Fewer get rejected. Payments come back faster.
The math is direct. A hospital processing 500,000 claims annually that drops its denial rate from 8 percent to 4 percent recovers millions in revenue that would otherwise require appeals or write-offs. Stack the staff hours saved on manual reporting against the software cost, and the return is straightforward.
HFMA research documents three consistent improvements from analytics adoption:
Denial rates fall 20 to 40 percent within months of implementation. Clean claim rates rise above 95 percent when errors are caught before submission. Payment cycles shorten by 15 to 25 percent as real-time bottleneck identification replaces guesswork.
Predictive analytics accelerates all three. Denial trends surface as they develop — not during month-end reconciliation. For CFOs evaluating the investment, the question is straightforward: does the software save or recover more than it costs? The evidence consistently says yes.
How Executive Dashboards Support Financial Decisions
An executive RCM dashboard puts every key financial number in one place, updated in real time. Health systems use them to track metrics like days in accounts receivable (target: 30 to 45 days) and denial rates without waiting for a report to be built.
The dashboard functions as a command center. Log in and see exactly where you stand against targets. If denials spike from a specific payer, you know immediately — not 30 days later when the trend report arrives.
The metrics that matter most tell a complete story together:
Denial rate trends pinpoint which payers or providers need attention. Net collection rate reveals whether you collect everything your contracts entitle you to. Charge lag measures how quickly services convert to billable claims. Cash flow forecasts let you plan the coming months with actual data rather than estimates.
Drilling down surfaces the actionable detail. Filter by payer, department, or individual provider. If the emergency department has a denial pattern or one insurance carrier consistently underperforms, the dashboard shows you exactly where to focus.
Transparency changes how leadership operates. Your CFO, revenue cycle director, and department heads work from the same numbers. Meetings start with data instead of arguments about whose spreadsheet is right.
Which Revenue Cycle Metrics Matter Most?
Five core metrics determine whether your revenue cycle is healthy. Industry benchmarks give you the targets.
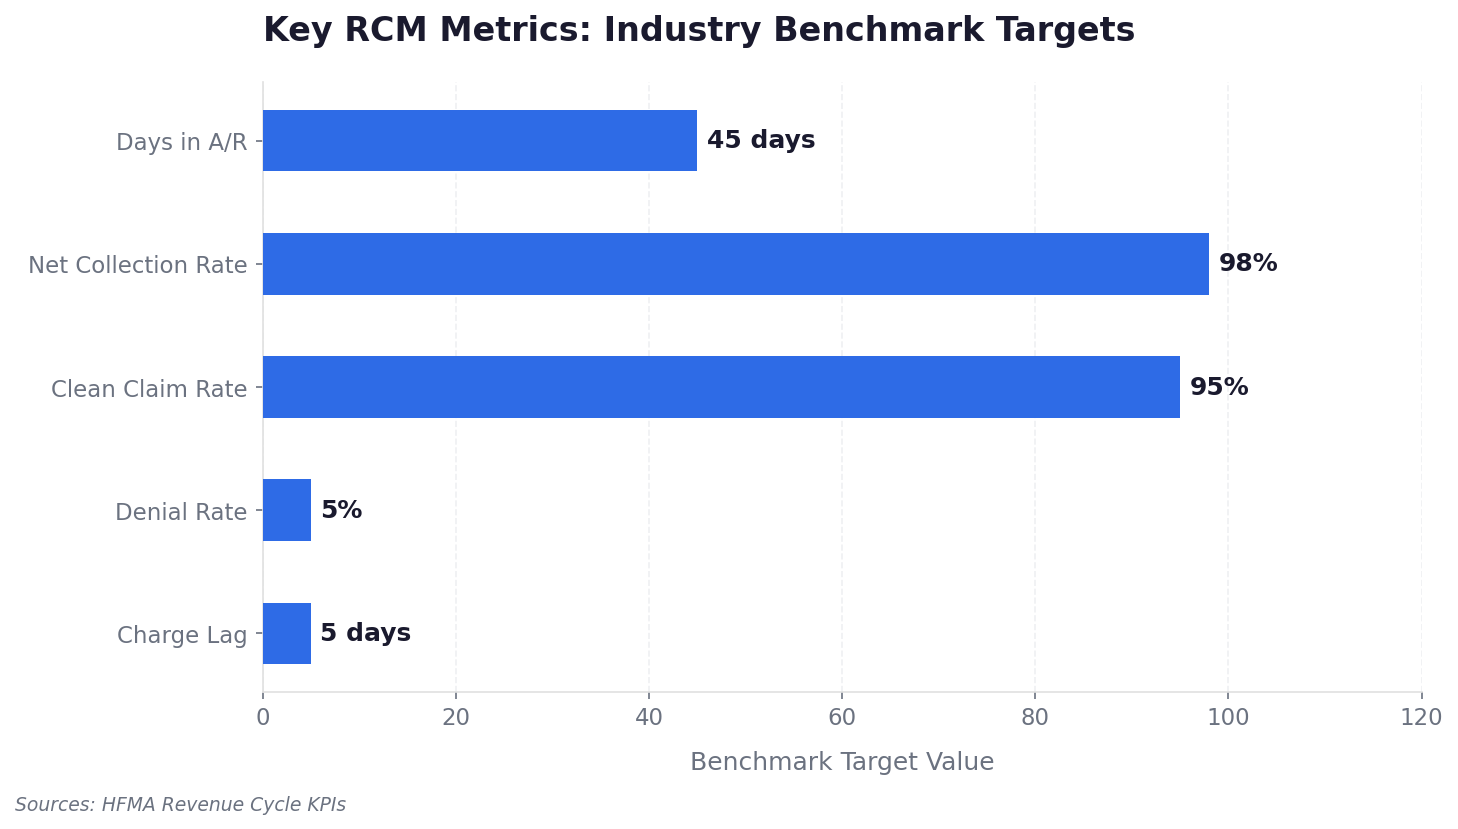
Denial rate hits cash flow directly. Every rejected claim costs staff time to appeal or rewrite and risks permanent write-off if appeal windows close. Days in accounts receivable measures collection velocity — longer AR days mean slower cash and higher non-payment risk.
Clean claim rate reflects front-end accuracy. Each percentage point improvement translates to fewer interruptions for your billing team and more first-pass payments. Net collection rate is the truest performance measure: what you actually collected versus what your payer contracts say you should have received. Falling below 95 percent means money is walking out the door.
Charge lag captures operational friction upstream. Billing delays slow everything downstream. Tracking these metrics in isolation misses the systemic view — poor claim quality drives denials, denials stretch AR days, and cost to collect climbs. Watch trends across three or more months, not single-month snapshots.
How AI Automation Improves Claims and Denial Management

Artificial intelligence in revenue cycle management analyzes claims and flags errors before submission. Healthcare organizations using predictive RCM analytics report 20 to 30 percent faster claim resolution, according to HFMA research.
AI has moved well past simple rule-based automation. Machine learning models trained on millions of claims detect patterns humans would miss: coding combinations that trigger denials from specific payers, documentation gaps that lead to rejections, and subtle submission issues visible only in the aggregate data.
Five core AI capabilities drive results:
Claims scrubbing engines check every claim against payer-specific rules before submission. AI coding assistance reviews clinical notes and surfaces accurate CPT and ICD codes. Automated claim generation applies payer-specific formatting without manual intervention. Denial categorization reads rejection reasons and routes claims to the correct workflow. Natural language processing generates appeal letter language based on the specific denial text.
When denials happen, AI accelerates the appeal. What used to require experienced staff reviewing cases manually now takes seconds. Claims with AI-validated accuracy move through payer systems without being returned. Denials caught early get appealed before payment windows close.
Manual review workload drops significantly because automation handles routine validations. Experienced staff focus on the complex cases that actually require human judgment — payer strategy, unusual coding scenarios, high-value appeals. AI doesn't replace the revenue cycle manager. It gives them leverage on the work that matters most.
How Predictive Analytics Drives Better Decisions
Predictive analytics uses historical claims data to forecast payment risk and revenue trends. The shift it enables is from reactive to proactive: identifying high-risk claims before submission rather than diagnosing denial patterns after the fact.
Predictive models work across three dimensions:
Payer behavior patterns reveal which carriers consistently underpay specific codes. Patient payment likelihood estimates who will pay, enabling smarter financial counseling before services render. Claim approval algorithms score each claim's probability of first-pass acceptance, so your team knows where to focus pre-submission review.
The executive insights go beyond operations. Systemic payer contract issues emerge when denial patterns show consistent underpayment on specific service lines. Revenue leakage patterns surface from aggregated data that no single claim review would reveal. Projected cash flow for the coming quarter lets you adjust operations before revenue suffers.
How Automated Payment Processing Improves Cash Flow
Automated electronic remittance advice (ERA) processing matches claims and payments the day remittance arrives. Without automation, matching ERA data to the correct claims requires hours of manual work and introduces errors that compound downstream.
NACHA, the federally recognized standards body for healthcare electronic funds transfer, documented that a group of 165 hospitals achieved a 70 percent reduction in processing costs for claims reimbursed via EFT and ERA through improved payment posting and reconciliation.
Auto-posting applies payer payments to the correct claims without human touch. Underpayment identification flags payments below contract rates immediately — while appeal timelines are still open. Contract modeling validation cross-checks payments against negotiated terms at the claim level. Faster reconciliation reduces administrative burden across the billing team.
Staff previously spending hours on payment matching now handle complex variance investigations that genuinely need human attention. The work becomes more strategic.
Integrated Platforms vs. Standalone BI Tools
Standalone BI tools run $500 to $2,000 per month and require significant custom work to connect with RCM data. Analytics built directly into RCM platforms integrates with billing workflows from day one and eliminates the data silo problem.

Tools like Tableau or Power BI offer strong visualization, but they require IT to extract, transform, and load RCM data into structures the tool can read. For multi-specialty practices, that complexity multiplies across different billing rule sets. Cardiology practices, for example, benefit from platforms built around their specific coding and reimbursement patterns rather than general-purpose analytics layered on top.
Integrated platforms pull from claims, eligibility, and payment systems through pre-built pipelines. Everyone works from the same definitions. Metrics stay consistent across departments.
The operational distinction matters most. Standalone tools show you what happened. Integrated platforms connect that insight to action — see a denial pattern, drill into specific claims, fix issues, and resubmit without leaving the analytics environment. When finance and revenue cycle run different numbers, meetings become debates. An end-to-end platform establishes one source of truth.
How Real-Time Analytics Improves Patient Collections
Real-time analytics track patient billing, payment plans, and unpaid balances across the revenue cycle. Healthcare providers using analytics-driven patient engagement tools report up to 25 percent higher patient collections, based on Becker's Hospital Review research into patient payment behavior.
High-deductible plans have shifted a growing share of revenue responsibility directly to patients. Collection effectiveness now depends on communication and transparency as much as billing accuracy.
Patient portals and self-service payment tools give patients direct access to balances, payment options, and plan status — without waiting for paper statements. Analytics tracks which communication channels produce payments and which need adjustment.
Data-driven patient segmentation moves practices away from one-size-fits-all collection strategies. Predictive models estimate payment probability based on history and service type. High-probability patients go to self-service workflows. Lower-probability patients trigger financial counseling before services render, when there is still time to establish a workable plan. Tailored payment structures reflect what actually works with different patient populations — not what seems reasonable in theory.
Patients who understand costs before services report higher satisfaction than those surprised by bills afterward. Transparency improves both collections and experience.
Financial Stability Built on Data
Analytics-driven RCM implementation follows a predictable pattern: denial rates fall, AR days shorten, cost to collect drops, and net collection rate climbs toward its contracted ceiling. Healthcare organizations that implement these strategies consistently recover millions in revenue that was previously slipping through process gaps.
The ROI metrics tell the complete story. A 5 percent denial reduction on $100 million in annual claims recovers $5 million. Reduced administrative workload adds another $500,000 or more in operational savings. Against platform costs, the return is clear — and it compounds as clean claim rates improve and payment cycles accelerate.
Long-term financial stability depends on revenue cycle performance. Organizations that see cash flow clearly can invest in growth with confidence. Those that capture everything they earn build reserves for uncertain periods. Measuring ROI in medical billing is not a one-time calculation — it is an ongoing discipline that separates organizations that grow from those that scramble.
Frequently Asked Questions
What is a good denial rate for revenue cycle management?
Under 5 percent is the industry benchmark for high-performing organizations, according to HFMA standards. Rates between 5 and 10 percent indicate meaningful room for improvement. Anything above 10 percent signals significant revenue leakage requiring immediate remediation.
How long does RCM analytics software take to show ROI?
Most healthcare organizations achieve positive ROI within 12 to 18 months of implementation. Early gains — reduced denial rates and improved clean claim rates — frequently appear within 3 to 6 months. Full financial returns materialize as payment cycles accelerate and net collection rates improve.
What metrics should CFOs track in revenue cycle dashboards?
The core five are denial rate, days in accounts receivable, clean claim rate, net collection rate, and charge lag. Real-time visibility into cash flow forecasts, payer-specific performance, and patient payment trends provides the strategic layer needed for financial planning beyond month-end.
How does RCM analytics integrate with existing EHR systems?
Modern platforms integrate directly with major EHR systems through APIs and HL7/FHIR interfaces. Real-time data exchange eliminates manual exports and keeps clinical and financial data synchronized across systems.
Can small practices benefit from RCM analytics software?
Yes. Small practices gain proportional returns through reduced administrative work, faster payments, and improved denial management. Cloud-based platforms with scalable pricing make analytics accessible at any size, with ROI typically achieved within the first year.
ENTER's platform connects analytics to action across every stage of the revenue cycle — real-time dashboards, automated denial prevention, and direct EHR integration that keeps your data synchronized without manual work. If your denial rates are climbing or your AR days are stretching, the data to fix it already exists. ENTER helps you see it and act on it.
Results
Sources
About the Author


ENTER is HIPAA compliant and SOC 2 Type 2 certified. See our trust center to learn more.