Talk to Sales
What Does a Denied Claim Really Cost? The Math Behind Denial Management ROI
U.S. healthcare providers spend $20 billion every year not delivering care — just undoing the damage of denied claims. That figure, from the American Hospital Association, doesn't account for the revenue that never comes back at all. Between 35% and 60% of denied claims are simply abandoned. The care was delivered. The bill was never paid.
This is the denial management problem in full: a compounding, self-funded tax on every organization that bills insurance.
Key takeaways
- Reworking a single denied claim costs $25 to $117, driven almost entirely by labor
- One-third to more than half of denied claims are never resubmitted
- Preventing denials cuts those costs to near zero while accelerating payment by 45–60 days
The Real Numbers Behind a Denied Claim
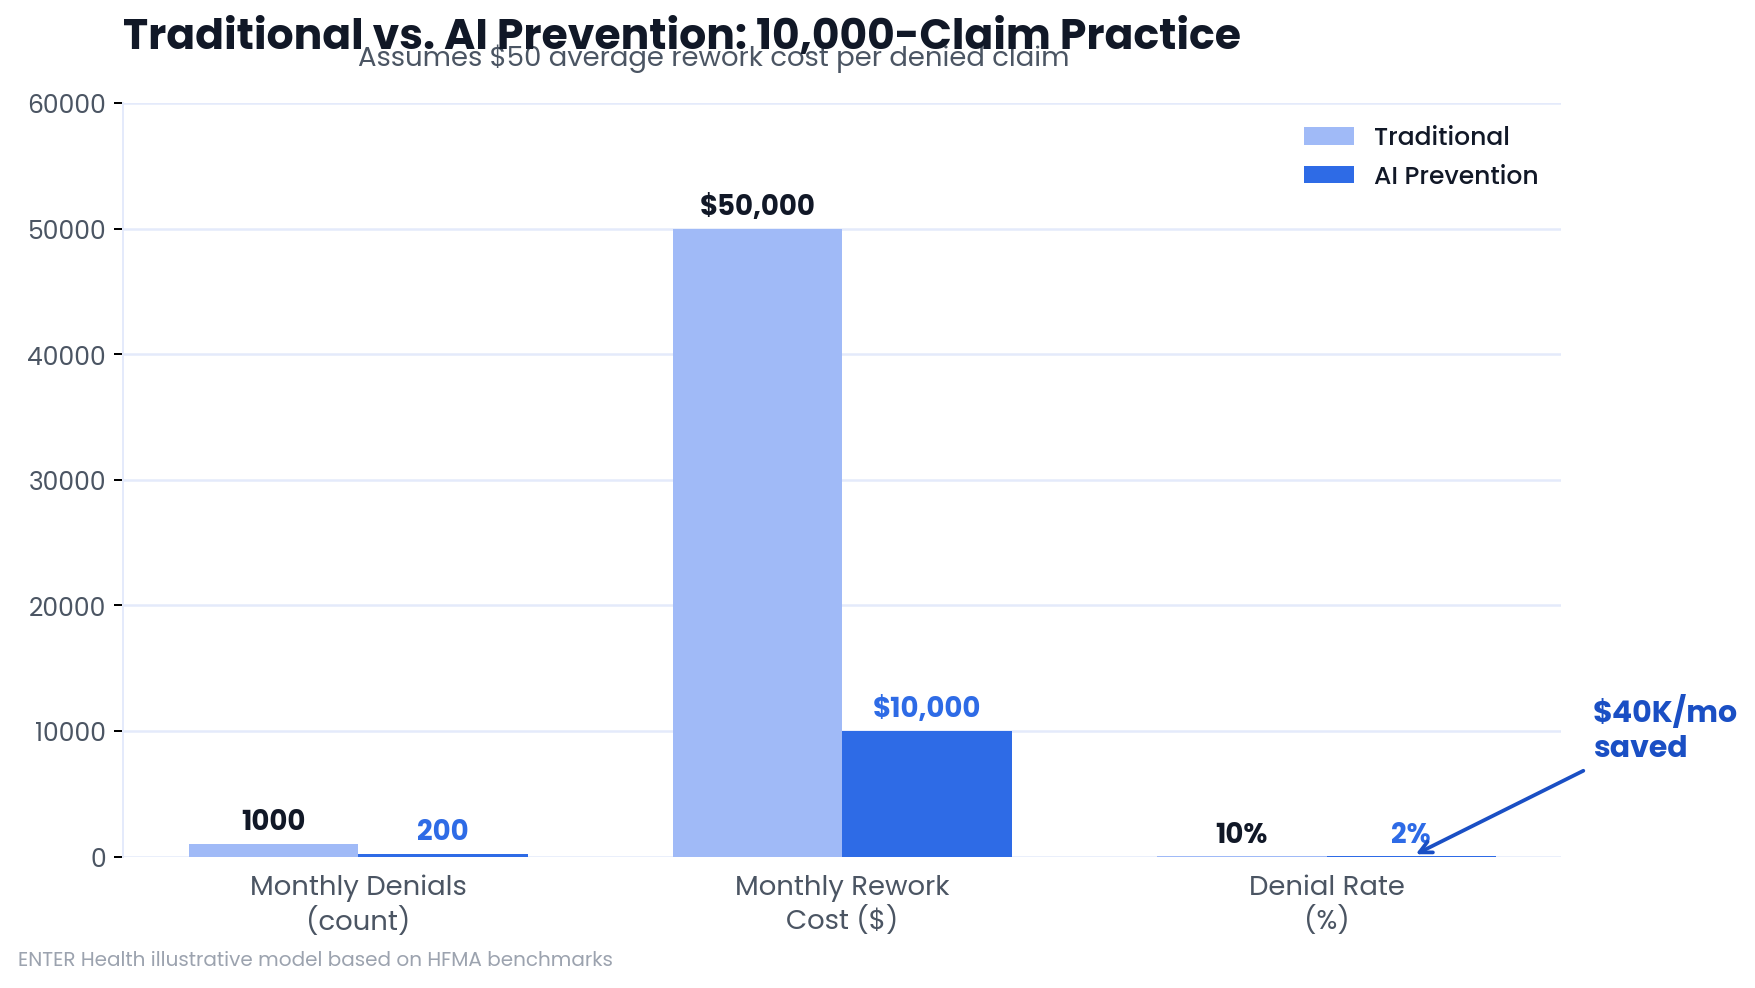
The Healthcare Financial Management Association (HFMA) puts the rework cost for a single denied claim at $25 to $117. Most of that cost is labor: billing staff investigating the denial, navigating payer portals, gathering medical records, and resubmitting everything correctly. For a practice processing 10,000 claims per month at a 10% denial rate, that's $50,000 in monthly rework costs before you account for the claims that never get fixed.

What a Denied Claim Actually Is
A denial is not the same as a rejection. Rejections are caught before a claim enters the payer system — typically by your billing software or clearinghouse — and require simple corrections. A denied claim has been processed and refused. The care happened. The payer reviewed it and said no. Getting to yes requires a formal appeal.
Denials cluster around a handful of causes: eligibility errors, diagnosis and procedure code mismatches, missing documentation proving medical necessity, and prior authorization failures. Medicare Advantage plans deny roughly 17% of initial claims, and more than half of those denials are eventually overturned on appeal. That means an insurer denied a valid claim, a staff member had to build a case and fight it, and the insurer ultimately reversed the decision. Every hour spent on that appeal was a billing hour that didn't generate revenue.
The operational damage extends further. Days in accounts receivable stretch out. Staff capacity gets consumed by reactive work. Financial planning becomes harder when payment cycles are unpredictable.
Why Rework Costs What It Does
CAQH data puts labor at 90% of claims processing costs. Denials make that labor cost multiply.
Investigation. Before a staff member can fix a denial, they have to understand it. That means checking payer portals, reviewing the original claim, making phone calls, and determining what went wrong and why.
Appeals. A formal appeal requires documentation: clinical records, written explanations, correct submission format, and follow-up. A single appeal can absorb several hours of staff time.
Front-end failures. Most denials trace back to errors made before a claim ever reached the payer — bad patient data, unverified insurance, coding mismatches. Correcting them after denial is expensive. Catching them before submission costs a fraction of that.
How Denials Damage Cash Flow
Every unresolved denial is money sitting in limbo. Kodiak Solutions data shows days in accounts receivable rose more than 5% in 2024. Denials are a primary driver.
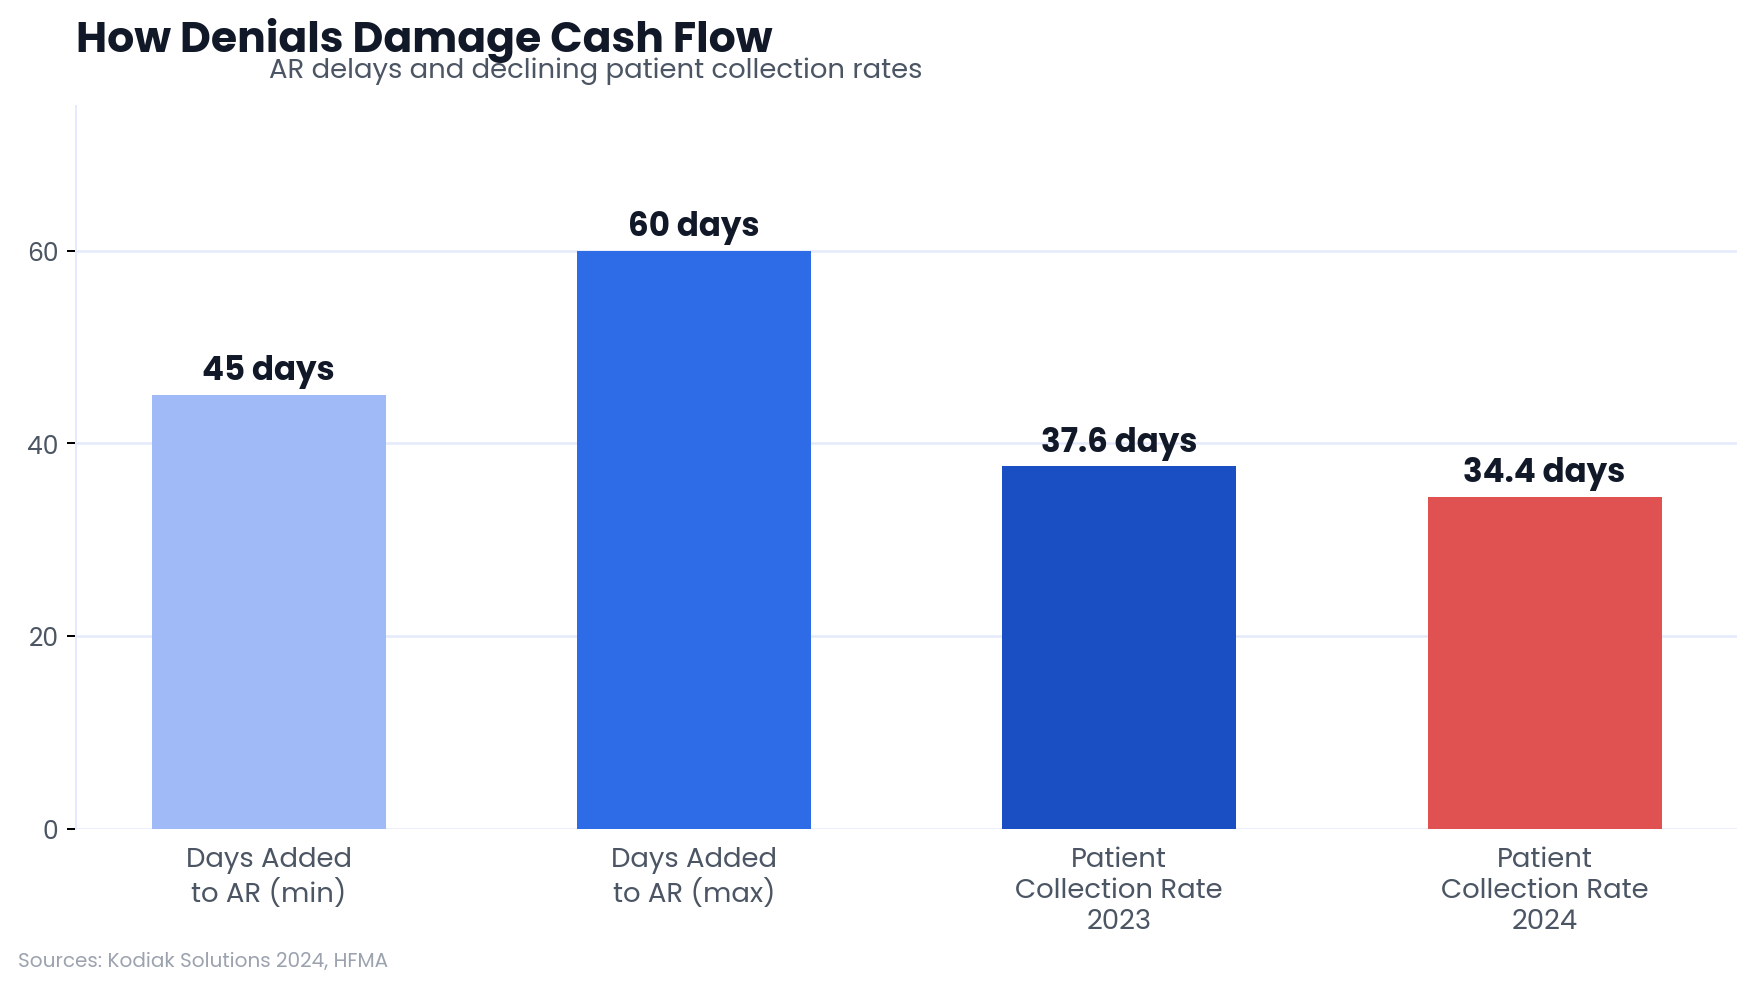
The downstream effects compound. Staff burnout from repetitive appeals work drives turnover, and replacing trained billing staff is expensive. Meanwhile, Kodiak Solutions also reports that providers collected only 34.4% of patient-owed balances in 2024, down from 37.6% the prior year. Delayed billing from denial backlogs is part of the reason: by the time a claim resolves, patients have moved on or lost track of their financial responsibility.
How to Calculate Denial Management ROI
HFMA's MAP Keys benchmark the industry average denial rate at approximately 10%. Using that baseline, the ROI calculation for denial management is straightforward:
(Recovered Revenue − Denial Management Cost) ÷ Denial Management Cost
Inputs you need: monthly claims volume, current denial rate, average rework cost per denied claim, recovery rate on appealed claims, and the monthly cost of any prevention tools or additional staff.
A concrete example: 10,000 claims monthly, 10% denial rate, $50 rework cost per claim. Monthly rework spend: $50,000. If prevention tools cost $15,000 per month and reduce denials to 3%, rework costs drop to $15,000. Net savings: $35,000 monthly — before accounting for faster payment cycles and the claims that would otherwise be abandoned.
The Hidden Costs That Don't Appear on a Spreadsheet
Clearinghouse fees are one. Each resubmission triggers another fee. Multiple appeal rounds on the same claim multiply those fees while adding zero value. They're small individually; they aggregate quickly.
Revenue leakage is the bigger number. CAQH data shows 35% to 60% of denied claims are simply dropped. That's not administrative waste — it's revenue from services already delivered that never gets collected.
Operational displacement is the hardest to quantify. Staff fighting appeals aren't verifying insurance before visits, following up on clean claims, or catching front-end errors early. Reactive work creates capacity constraints that produce more front-end errors, which generate more denials. The cycle funds itself.
How Traditional Denial Management Approaches Compare
The common problem across all three: they respond to denials after the fact. Whether the work happens in-house or through a vendor, the $25–$117 rework cost per claim still applies. For a comparison of denial management software vs. Waystar options, that analysis is worth reviewing separately.
Preventing Denials vs. Managing Them
Prevention changes the math entirely. When billing errors are caught before submission, the rework cost drops to near zero — a staff correction takes minutes, not hours of appeals work. AI-powered platforms that predict and prevent insurance claim denials operate on this principle: flag the problem before it becomes a denial.
The front-end controls that drive prevention include automated insurance verification at registration, provider credentialing checks against each payer, real-time coding validation against current payer rules, and clinical documentation prompts that ensure supporting records exist before submission. Requests for additional information — now driving more than 5% of denials — drop when documentation is complete on first submission.
AI-powered denial management platforms using this approach reduce denial rates from the 10% industry average to 3% or below.
What a Mid-Sized Practice Would Save
For a practice submitting 10,000 claims per month at a $50 average rework cost:
---
Monthly savings: $40,000.
The 800 prevented denials also get paid 45–60 days faster. The practice eliminates the risk that 35%–60% of those claims would have been abandoned. And staff redirect their time toward proactive revenue work rather than appeals.
Frequently Asked Questions
How do claim denials affect days in accounts receivable?
Denials add 45 to 60 days to the average collection cycle. Each appeal round extends that window further, disrupting cash flow and making financial forecasting unreliable.
What's the difference between a rejected claim and a denied claim?
Rejections are caught before the claim enters the payer system — usually by billing software or a clearinghouse — and require simple corrections. Denied claims have been processed and refused. They require formal appeals, supporting documentation, and follow-up, making them significantly more expensive to resolve.
How does predictive analytics reduce denial rates?
Predictive tools analyze claims data for patterns that correlate with denials. AI platforms use those patterns to flag high-risk claims before submission, allowing staff to correct errors when the fix is cheap rather than after denial when it isn't.
What role does clinical documentation play in denial prevention?
Complete documentation establishes medical necessity — the single most common basis for denial during utilization review. When physicians document specific patient conditions and treatment rationale, payers have less grounds to question claims.
Why do Medicare Advantage plans generate more denials than traditional Medicare?
Medicare Advantage plans use proprietary review processes that differ from traditional Medicare. Studies show they deny approximately 17% of initial claims, with more than half of those denials reversed on appeal — a significant administrative burden for providers.
Stop Paying to Fix Problems You Could Have Prevented
The $25–$117 rework cost per denial isn't the real number. The real number includes the 35%–60% of denied claims that get abandoned entirely, the 45–60 days of delayed cash flow, and the staff capacity consumed by appeals work that should never have been necessary.
ENTER's platform catches billing errors before claims submit — automated insurance verification, real-time coding validation, documentation checks — so claims go out clean and get paid on first submission. The result is a 97% clean claim rate and payment cycles shortened by 45–60 days. If you want to see what that looks like against your current denial volume, schedule a demo.
Results
Sources
About the Author


ENTER is HIPAA compliant and SOC 2 Type 2 certified. See our trust center to learn more.